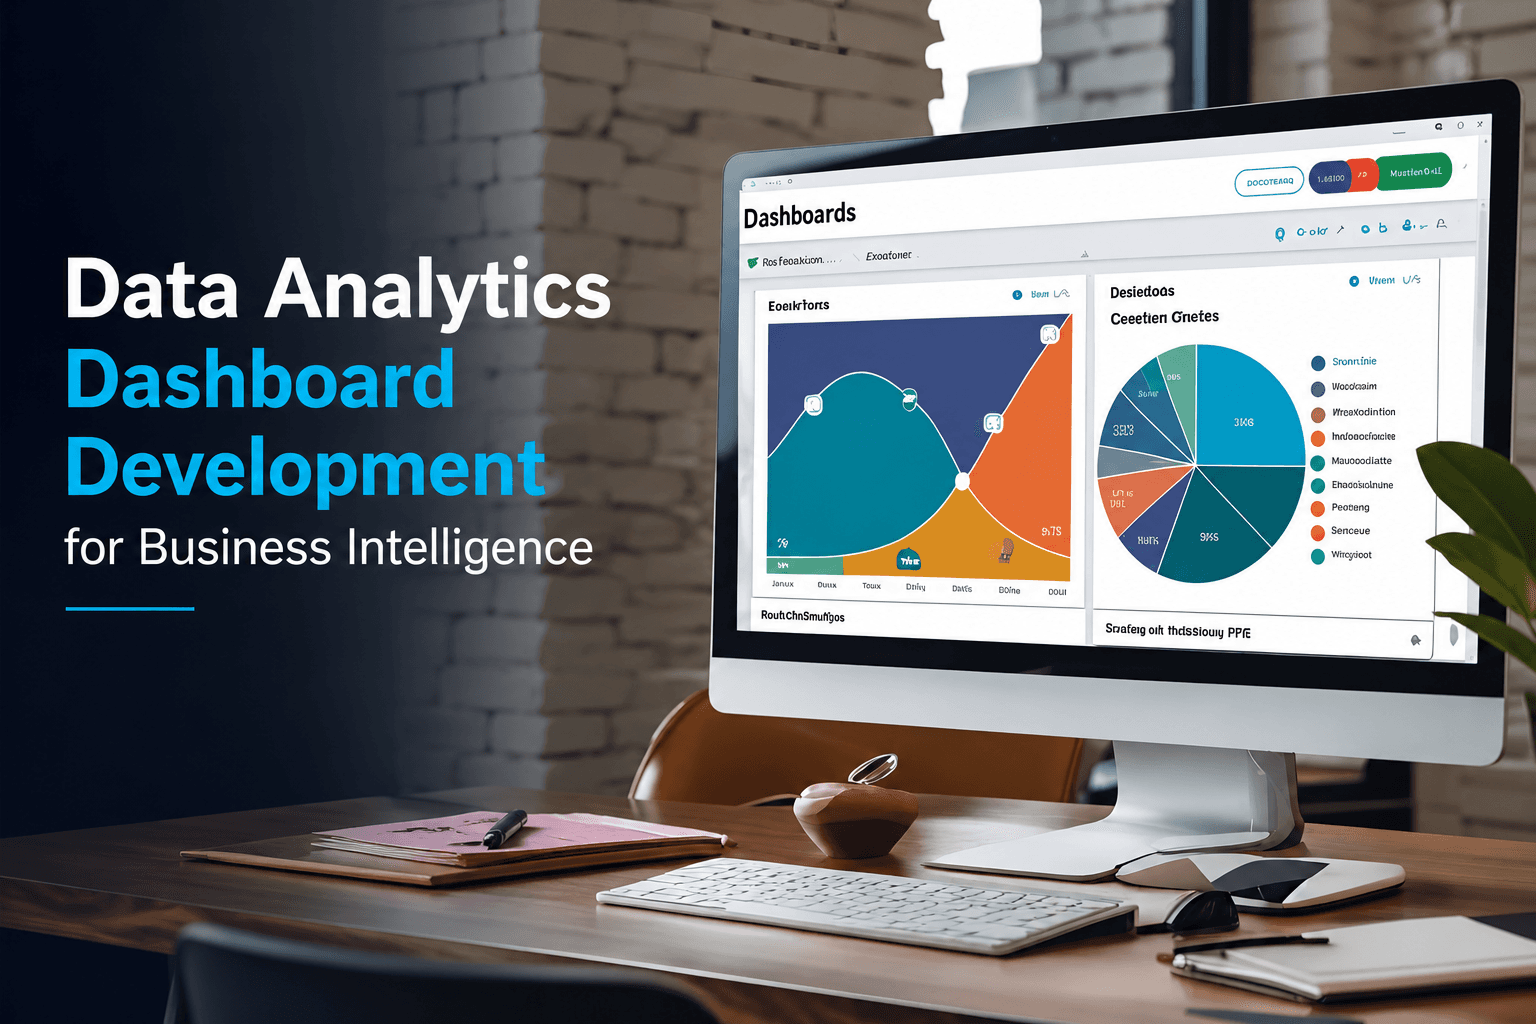
Most operations leaders don't lack data - they lack a single, accurate place to see it. Sales numbers live in the CRM, financials sit in accounting software, support metrics are stuck in a helpdesk tool, and getting a real picture of the business means opening five tabs, exporting spreadsheets, and hoping nothing got missed along the way. This blog looks at what custom BI dashboard development actually involves, and why businesses running multiple disconnected tools increasingly move toward a purpose-built solution rather than another generic reporting add-on.
Why Businesses Outgrow Generic Dashboard Tools
Off-the-shelf BI platforms handle standard reporting reasonably well, but common limitations show up as data sources and reporting needs grow more specific:
- Pre-built connectors that don't cover every system your business actually uses
- Generic templates that show broad metrics rather than the specific KPIs your team actually tracks
- Per-seat or per-report pricing that becomes expensive as more teams need access
- Limited ability to combine data across sources in the exact way your business actually needs to see it
For businesses with fairly standard reporting needs, generic platforms work well. For businesses pulling data from a specific mix of tools, or needing metrics calculated in ways a generic template doesn't support, the gap tends to widen over time.
What a BI Dashboard Actually Needs to Do
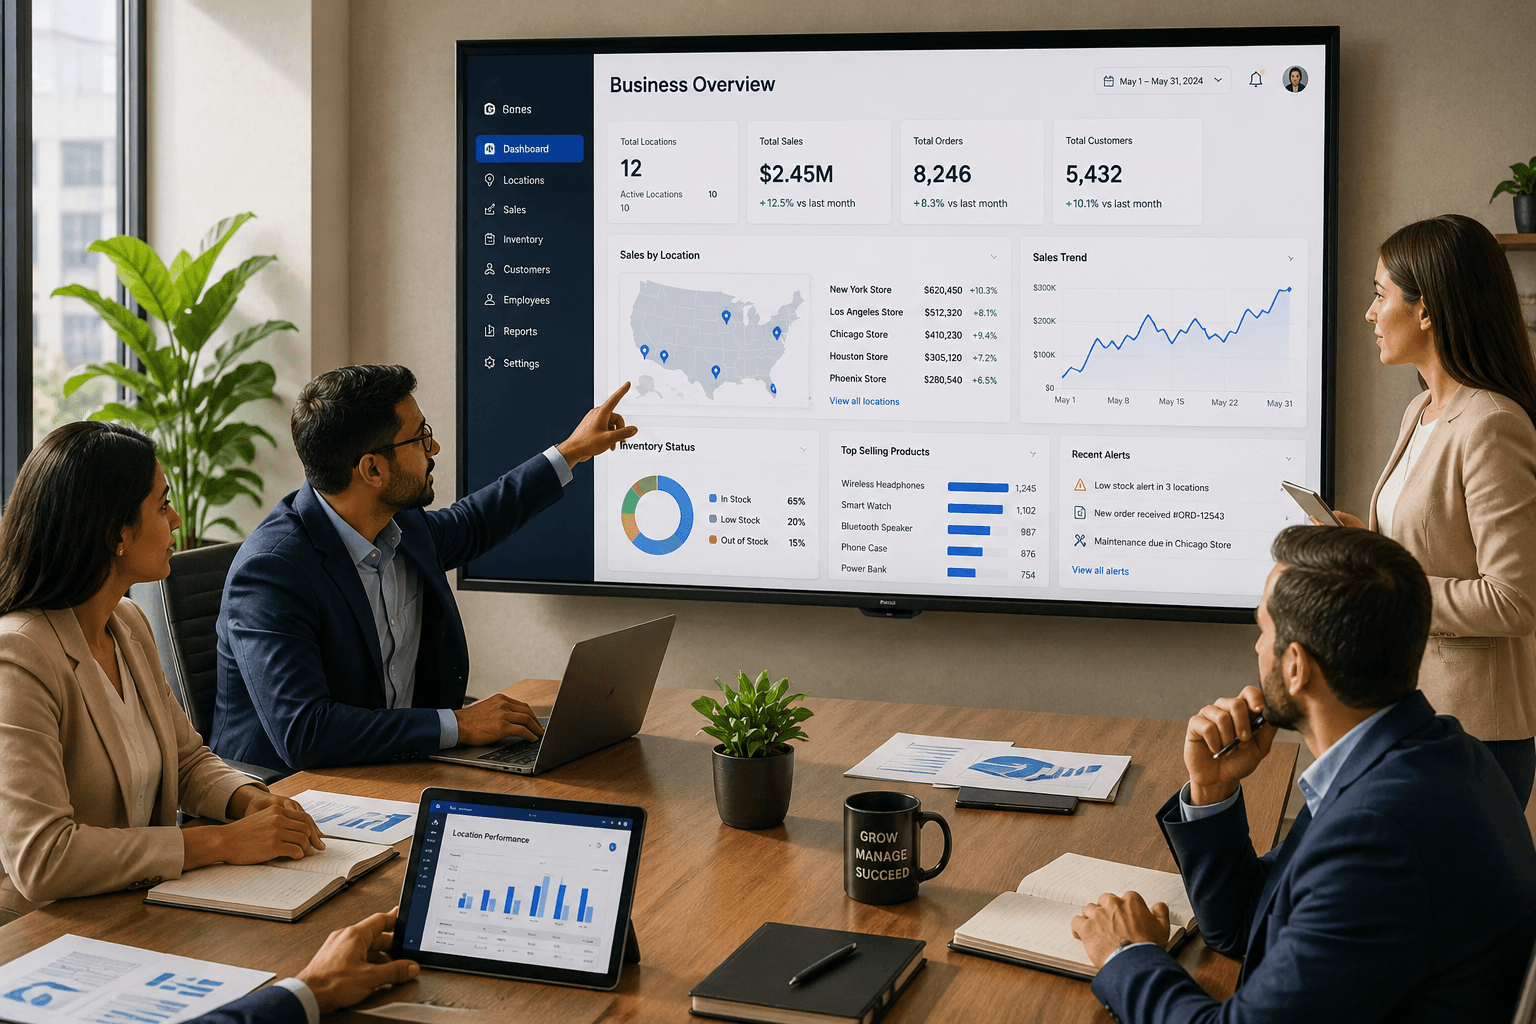
At its core, a business intelligence dashboard needs to pull data from multiple sources, process it into something meaningful, and present it in a way people can actually act on. This typically involves:
- Connecting to and pulling data from every relevant system, not just the most common ones
- Cleaning and reconciling data that may be formatted differently across sources
- Calculating the specific metrics and KPIs that actually matter to your business
- Presenting that information visually, updated in something close to real time
The complexity isn't in displaying a chart - it's in making sure the numbers behind that chart are accurate, current, and actually mean what people think they mean.
Why Custom Dashboard Development Solves the Integration Problem
The single biggest reason businesses move to custom BI dashboards is integration. Through dedicated Custom Software Development, a dashboard can be built to connect precisely to your actual systems - including internal tools, legacy software, or niche platforms a generic BI tool simply doesn't support out of the box.
This typically includes:
- Custom data connectors for systems without a standard pre-built integration
- Data pipelines that reconcile inconsistent formats across different sources automatically
- Metric definitions built around how your business actually calculates them, not a generic default
- Role-based views so different teams see the specific data relevant to their work
Real-Time vs. Periodic Reporting
Not every metric needs to update in real time, and building everything that way adds unnecessary cost and complexity. Custom dashboard development allows you to be deliberate about this:
- Operational metrics that genuinely need real-time visibility, such as live order or inventory status
- Strategic metrics that are meaningful on a daily or weekly cadence, without needing constant updates
- Historical trend data that supports longer-term analysis rather than moment-to-moment monitoring
Matching update frequency to what a metric actually needs, rather than defaulting everything to "real time," keeps the system faster and easier to maintain.
Where AI Adds Real Value to a BI Dashboard
Beyond simply displaying data, AI Automation can add genuine analytical depth to a custom dashboard, including:
- Anomaly detection that flags unusual patterns automatically, rather than requiring someone to notice them manually
- Predictive trend indicators that project likely outcomes based on current data patterns
- Natural language summaries that translate dense data into plain-language takeaways for non-technical stakeholders
- Automated alerts when key metrics cross thresholds that actually matter to the business
These capabilities go beyond what most generic BI tools offer as standard features, particularly when tuned to your specific metrics and business context.
Designing Dashboards People Actually Use
A common failure mode in BI dashboards, custom or off-the-shelf, is trying to show every available metric rather than focusing on the specific decisions users actually need to make. Effective dashboard design starts with understanding what decisions each user or team is trying to make, then building views around that, rather than defaulting to a data-dump approach that looks comprehensive but ends up unused.
Mobile Access for Leaders on the Move
Executives and operations leaders often need to check key metrics away from a desk. Through Mobile App Development, dashboard access can extend to mobile devices with views optimized for smaller screens, so checking performance doesn't require waiting until someone's back at a laptop.
Data Security and Access Control
Business intelligence dashboards often surface sensitive financial, operational, or customer data, making role-based access control and secure data handling a genuine requirement, not an afterthought. Custom development allows access permissions to be built precisely around your organizational structure, rather than working within whatever access model a generic platform happens to offer.
Making the Case for a Custom BI Dashboard
Custom dashboard development tends to deliver the strongest value when:
- Your data lives across a specific mix of tools that generic platforms don't fully support
- You're manually reconciling data across multiple systems on a recurring basis
- Standard dashboard templates don't reflect how your business actually calculates its key metrics
- Per-seat licensing costs are becoming significant as more teams need dashboard access
For businesses with fairly standard data sources and reporting needs, an established BI platform may remain the more practical choice - the decision comes down to how far your actual reporting needs diverge from what a generic tool assumes.
Related Services
- Custom Software Development - architecting dashboards and data pipelines around your actual systems
- AI Automation - powering anomaly detection, predictive trends, and automated alerts
- Mobile App Development - extending dashboard access to leaders on the go
- Web Development - building the dashboard interfaces teams use day to day
Related Blogs
- Software Integration 101: Making Your Tools Work Together
- Enterprise Software vs SaaS: Making the Right Choice for Scale
Frequently Asked Questions
Why do businesses move from generic BI tools to a custom dashboard?
Generic platforms often lack connectors for specific systems businesses actually use, or calculate metrics using generic definitions rather than how the business actually measures them, which is where custom development closes the gap.
Does every metric on a BI dashboard need to update in real time?
No. Real-time updates make sense for operational metrics like live inventory, while strategic or trend metrics are often just as useful updated daily or weekly, which keeps the system simpler and faster.
How does AI improve a custom BI dashboard beyond basic charts?
AI can add anomaly detection, predictive trend indicators, and automated alerts, surfacing insights proactively rather than requiring someone to manually notice patterns in the data.
Is a custom BI dashboard only worth it for large enterprises?
Not necessarily. It tends to make sense once data sources, reconciliation effort, or licensing costs across multiple teams outweigh the convenience of a generic platform, regardless of company size.
How is data security handled in a custom BI dashboard?
Access permissions can be built precisely around your organizational structure and role-based needs, rather than relying on whatever access model a generic platform happens to offer.
Ready to Unify Your Data Into One Clear View?
If your team is still stitching together spreadsheets from five different tools just to answer a basic business question, that's a strong sign a generic dashboard tool has stopped being enough. Weboraz builds BI dashboards architected around the specific systems your business actually runs on, with AI-driven insights layered in where they genuinely help decision-making. Contact Us to talk through what a dashboard built around your real data sources would look like.
Frequently asked questions
Generic platforms often lack connectors for specific systems businesses actually use, or calculate metrics using generic definitions rather than how the business actually measures them, which is where custom development closes the gap.
No. Real-time updates make sense for operational metrics like live inventory, while strategic or trend metrics are often just as useful updated daily or weekly, which keeps the system simpler and faster.
AI can add anomaly detection, predictive trend indicators, and automated alerts, surfacing insights proactively rather than requiring someone to manually notice patterns in the data.
Not necessarily. It tends to make sense once data sources, reconciliation effort, or licensing costs across multiple teams outweigh the convenience of a generic platform, regardless of company size.
Access permissions can be built precisely around your organizational structure and role-based needs, rather than relying on whatever access model a generic platform happens to offer.
Related Articles

Need help applying this?
Our team can turn the ideas in this article into a clear plan and a polished build.
Contact Us